How to Read Forex Charts: A Visual Guide for New Traders (2025)
How to Read Forex Charts: A Visual Guide for New Traders (2025)
Mayid Al Jarrah
Forex
Start understanding price movements like a pro — even if you’re brand new
If you're just getting into Forex trading in 2025, you’ve probably opened a chart and thought, “What am I even looking at?” It’s normal. All those candlesticks, trend lines, colors, and fast-moving numbers can feel overwhelming at first.
But here’s the good news: Forex charts aren’t as complicated as they look. Once you understand the basics — and what each part of the chart is telling you — it all starts to make sense.
This beginner-friendly guide will walk you through everything you need to know to confidently read Forex charts and understand what price movements are really saying. By the end, you’ll have the tools to analyze the market like a developing pro — without getting lost in technical confusion.
A Forex chart is a visual representation of how a currency pair’s price moves over a certain period of time. It tells the story of the battle between buyers and sellers.
For example, if you’re looking at the EUR/USD chart, you’re seeing how many US dollars it takes to buy 1 Euro — and how that price has changed over minutes, hours, days, or weeks.
A chart helps you:
Track the current exchange rate
Understand recent price movement
Identify patterns and trends
Decide when to enter or exit a trade
You can think of it as a map — and as a trader, you need to know how to read the map before you start the journey.
What Is a Forex Chart?
1. Candlestick Charts (The Most Popular Type)
There are three main types of Forex charts:
Line Charts: Simple, show closing prices only
Bar Charts: More detailed, but less visual
Candlestick Charts: Most popular — and the one we recommend
🔍 What’s a Candlestick?
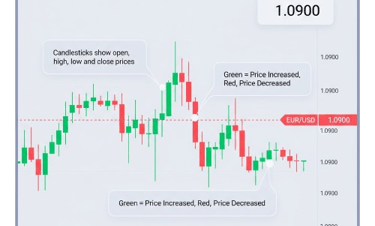
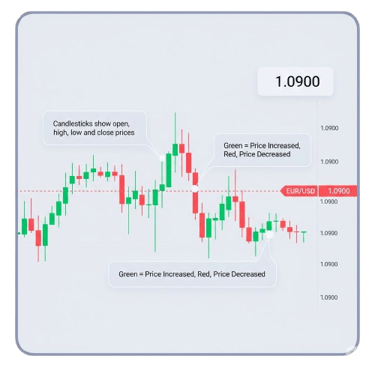
Each candlestick on your chart represents a specific time period — for example, 1 minute, 1 hour, or 1 day — and shows four key pieces of data:
Open: Price when the candle started
High: The highest price reached
Low: The lowest price reached
Close: Price when the candle ended
🟩🟥 Candle Colors
🟩 Green (or white) candle = Price went up during the period
🟥 Red (or black) candle = Price went down
These visual clues help you quickly see whether the market is rising or falling — and how strong the movement is.


2. How to Read the Price on a Forex Chart
When you open your chart, look at the right-hand side — that’s where you’ll see the current price of the currency pair.
💱 Example:
If EUR/USD shows 1.0900, that means:
1 Euro = 1.09 US Dollars
As the market moves, this number constantly updates in real time.
3. How to Identify Trends in a Chart
A trend is the general direction in which a market is moving. There are three types:
🔼 Uptrend: Price is making higher highs and higher lows
🔽 Downtrend: Price is making lower highs and lower lows
🔁 Sideways/Range-bound: Price moves within a range, without a clear direction
Why Trends Matter
Trading with the trend is one of the most effective strategies for beginners. It’s like swimming with the current instead of against it — it’s easier and more reliable.
🛠 Tools to Help Spot Trends
Trendlines: Manually drawn lines connecting lows in uptrends or highs in downtrends
Moving Averages: Help smooth out price and highlight the general direction
Price Action: Simply watching the shape and flow of candlesticks over time
4. Essential Forex Chart Tools Every Beginner Should Know
Forex trading platforms offer powerful tools to help you read charts and make informed decisions.
Here are a few you’ll use often:
You don’t need to master all tools at once. Start with just support/resistance and moving averages — add more later.
You don’t need to master all tools at once. Start with just support/resistance and moving averages — add more later.
5. How to Practice Reading Forex Charts (Safely)
Practice makes perfect — and thankfully, you can practice without risking real money.
✅ Steps to Start Practicing
Open a demo account (free) on platforms like:
MetaTrader 5 (MT5)
TradingView
cTrader
Choose a common currency pair like EUR/USD or GBP/USD
Practice the basics:
Drawing trendlines
Identifying support and resistance
Watching how candles react to market events
🗓 Set a Routine
Spend 20–30 minutes a day observing charts. Treat it like training. The more you observe, the faster your instincts will develop.
🚫 Don’t Fall for These Common Chart-Reading Mistakes
New traders often make chart-reading harder than it needs to be. Here are some mistakes to avoid:
❌ Using too many indicators: Clutters your screen and causes confusion
❌ Chasing price: Jumping into trades just because the market is moving
❌ Ignoring larger timeframes: A 5-minute chart looks noisy without the 1-hour or daily context
❌ Zooming in too much: You miss the bigger picture when too focused on short-term candles
❌ Not reviewing past charts: You learn faster by studying what’s already happened
Summary: The Forex Chart Reading Checklist
Here's a quick reference to remember:
✅ Choose candlestick charts
✅ Learn how to read open, high, low, and close
✅ Understand pips and price structure
✅ Spot trends using tools like trendlines and moving averages
✅ Practice with demo accounts before going live
✅ Keep your chart clean and your strategy simple
Final Thoughts: Chart Reading Is a Skill — Not a Shortcut
At first, Forex charts can feel like a foreign language. But once you start learning what each part means, you begin to see the rhythm and flow behind the markets.
Reading charts is not about predicting the future with 100% accuracy — it’s about reading the market’s behavior, identifying high-probability setups, and managing risk.
By learning to read charts:
You stop guessing
You trade with confidence
You react based on structure, not emotion
Remember: Charts are your roadmap. And the better you get at reading the map, the better your trading journey will be.